
Our goal is to constantly improve Plecto by bringing you new and exciting features.
We will regularly update this page, so check back often to learn about the latest changes!
You wouldn't be the first (or the last) to tell us, you accidentally deleted a dashboard and couldn't get it back. Well, we love to break it to you, now you can!
Good to know:
What it looks like:


For organizations that need tighter control over who sees what, new dashboards can now be private by default.
What's new:
Good to know:
How it looks:

*Want this for your organization? This feature isn't turned on by default for every account, but it's completely free. Reach out to your Customer Success Manager or our support team to get it enabled.
Turn your team's targets into a journey worth racing toward.
Say hello to the Milestone Contest — a brand-new contest theme that reimagines how your team experiences progress. Instead of a flat race or a ranked table, your team travels along a winding road, banking rewards at every checkpoint on the way to the final goal. 🛣️

✨ WHAT MAKES IT DIFFERENT
Most contests reward one thing: finishing first. The Milestone Contest rewards the whole climb.
🏁 Milestones along the way — set checkpoints (say 300, 500 and 650) leading up to a final goal. There's always a next win within reach.
🪙 Coins at every checkpoint — attach a coin reward to each milestone and the final goal. Rewards are granted per participant, so everyone who reaches a checkpoint earns them, not just the leader.
📍 A live journey — avatars move along the road as KPIs grow, milestones flip to "Done" as they're passed, and a leaderboard shows where everyone stands.
🎯 Built for any KPI — revenue, deals closed, calls made, tickets resolved… if you can track it in Plecto, you can build a Milestone Contest around it.
Because rewards land at every checkpoint and for every participant, mid- and late-pack performers stay motivated right to the finish. 💪
🎨 MAKE IT YOURS
⏱️ Toggle the countdown clock and prize on or off. 🖌️ Pick a background theme to set the mood. 🖼️ Upload a custom background image to match a campaign, season or brand moment.
📋 WHERE IT FITS Pick the Milestone Contest right from the theme selection screen, alongside Race in Space, Mountain Race, Truck Race, Jungle Climb and Classic.


🚀 GETTING STARTED
• Head to Contests and create a new one. • Choose the Milestone Contest theme. • Set your KPI, milestones, coin rewards and final goal. • Pick who's competing, add a prize — and let the race begin! 🏆 Try it today
Building a dashboard in Plecto has always been fast. Now it can be conversational.
Today we're rolling out the Plecto MCP server, a new way to connect your favorite AI assistant directly to your Plecto data. Instead of clicking through menus or writing formula syntax by hand, you can describe what you want in plain language and let your assistant build it for you.
MCP, or the Model Context Protocol, is an open standard that lets AI tools securely read and manage data in other applications. By connecting Plecto over MCP, assistants like Claude can create dashboards, build formulas, and add widgets on your behalf, all through natural conversation.
It works with any MCP-compatible client, including claude.ai, Claude Desktop, ChatGPT, and other tools that support remote MCP servers.
A single prompt can be enough to build a complete dashboard:
"Can you make me a dashboard for Aircall Calls in Plecto?"
Your assistant will explore the data source, create the formulas it needs, and place the widgets automatically: KPI tiles at the top, charts in the middle, a leaderboard below.

Follow-ups work the same way. Ask it to "replace the middle row with a funnel chart" and it removes those widgets and drops a full-width funnel into the same space, with no formula editor required.

The Plecto MCP endpoint is: https://app.plecto.com/api/mcp
To connect from claude.ai:
To connect from other clients: Any client that supports remote MCP servers (like ChatGPT) can use the same endpoint. Follow your tool's instructions for adding a remote MCP server. You'll be redirected to Plecto to sign in and pick an organization during authorization.
If you work across multiple Plecto organizations, double-check which one you authorize before you start building.
The Plecto MCP server is available now. Connect your assistant, describe the dashboard you've been meaning to build, and watch it come together in a single conversation.
Need a hand? Read the full setup guide or get in touch with our team.
Visualize your user journeys and deal stages instantly. With the Funnel chart widget you can see where users convert, spot the leaks in your flow, and optimize each stage — all from a single dashboard tile.
This guide walks you through creating a Funnel chart from scratch, configuring it, and reading the results.
A funnel breaks a process into ordered stages and shows how many records reach each one. Each stage displays its count (and/or percentage), and the drop badge between stages tells you what share was lost from the stage before it. An overall Conversion figure at the top shows how much of the starting volume made it all the way to the final stage.
Typical uses include:
Open the dashboard you want to add the funnel to and make sure Edit mode is on (toggle in the top bar). Then click Add widget in the top-right corner.

Your cursor turns into a crosshair. Click and drag across the dashboard grid to draw the area where the widget will sit. Don't worry about getting the size perfect — you can resize and move it later.

When you release, choose Funnel chart as the widget type. The configuration panel opens with three tabs: Data, Settings, and Time period. A live preview builds on the right as you make changes.
The Data tab is where you tell the funnel what to measure. There are two ways to build your stages, controlled by the Use single data source checkbox.
Leave Use single data source checked when all of your stages live in one data source and are distinguished by a field (for example, an Opportunity Stage or Status field). Plecto generates one funnel stage for each value in that field.


Tip: The widget title auto-fills with the data source name when you select it. Click the title at the top of the preview to rename it to something clearer for your viewers.
Uncheck Use single data source when your stages come from different sources, or when you want full control over which stages appear and in what order. Use the + Add stage button to add each stage one at a time and assign each its own data source. This is the best choice when you need the stages in a specific, meaningful sequence rather than however the field happens to be grouped.
The Settings tab controls how the funnel behaves and looks.

Switch to the Time period tab and open the dropdown to choose the window your funnel measures.

You can pick a period from the tabs at the top:
Select your period (in the example, Year to date), confirm the date range shown at the bottom, and click Apply.
With data and a time period in place, the preview shows the finished funnel: each stage with its count, the drop percentage between stages, and the overall Conversion rate at the top.

When you're happy with it, click Save widget. The funnel appears on your dashboard, where you can drag to reposition it or pull its edges to resize.
The biggest drop between two consecutive stages is usually your most valuable place to investigate — that's where a small improvement has the largest effect on the end result.
🚀 Build formulas just by describing them. Stop wrestling with syntax. The Formula AI Assistant lives inside the Formula Editor and turns plain-language descriptions into ready-to-use Plecto formulas.
Just tell the assistant what you want to measure, and it does the heavy lifting — whether you're a formula pro or building your very first KPI.
✨ What it does
💬 Natural language input: Describe what you want to calculate in plain words, and the assistant builds the formula. No syntax required. 🌍 Works in your language: Write your prompt in whichever language you prefer. 🔍 Clear explanations: It explains each part of the formula step by step, so you know exactly how your data is being used. 🔄 Chat vs. Build modes: Switch between asking the Help Center chatbot a question and having the assistant build a formula for you. ⚠️ No mystery errors: If it can't generate a formula, it tells you why.
🛠️ How it works
Go to Formulas and click on "+ New formula". Describe what you need: for example, "value of won deals from Pipedrive" and click Create. The assistant generates the formula along with an explanation. Review the data source, function, date field, and filters, then save. Do you already have a formula? Click Modify with GPT to change it the same way.

Available now inside the Formula Editor. Give it a try and let us know what you think! 👋
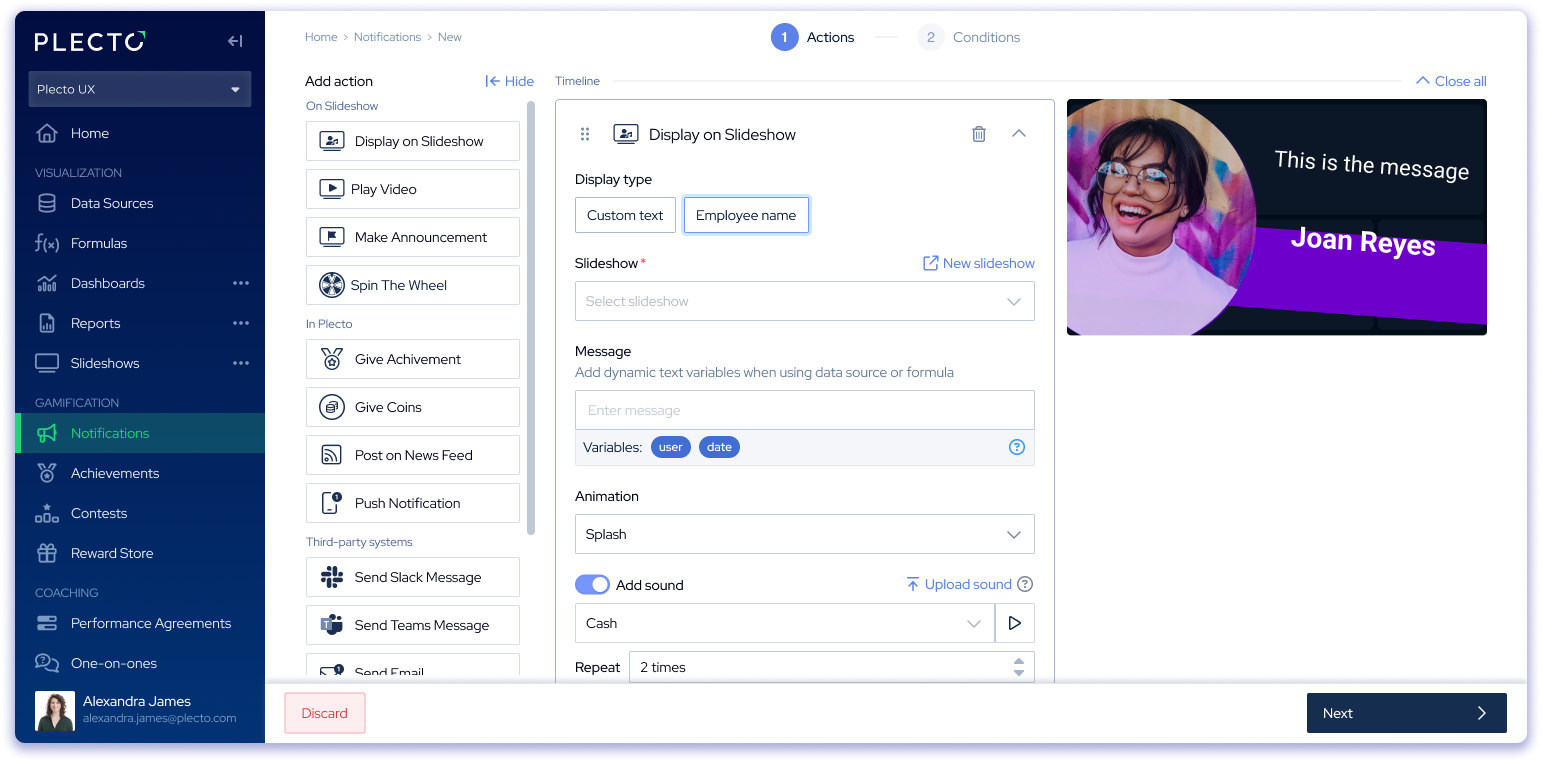
The Spinning Wheel is a fun way to give your employees the opportunity to win prizes, and it just got a few bonus functionalities...

Go to Notifications so you can set up a Spinning Wheel notification, add your dashboard to a TV slideshow, spin + watch your team enjoy a fun way of (maybe) winning cool rewards while working toward their goals!
Now all your Dashboards are neatly housed inside Plecto. These latest updates will make creating, editing, and using your dashboards to celebrate your team way more intuitive - putting our powerful gamification and TV streaming right at your fingertips!
Find out exactly what's been updated below:
Easily change or create cool color palettes for your dashboards with the Theme picker
Go to Dashboards to see what's updated, pin your favorite dashboards, add your dashboard to a TV, export your dashboard + more!
From now on, you’ll get a fresh gamification experience and more powerful Notifications to celebrate your team’s performance, share updates, and engage everyone using Plecto!
Along with these updates, we’ve introduced many performance and usability improvements, and there’s even more to come in Notifications!
💬 We’d love to hear your feedback! Visit the Product Portal to see what we're working on, submit your feedback, or add new ideas!
Here's how:
Your TV screen will reload and display the new Slideshow.
No app update needed, the feature is already live. Give it a try and let us know what you think! 📲
Whether you're a formula pro or just getting started, our new Formula AI Assistant removes the guesswork and helps you move faster.
✨ Feature Highlights:
💬 Natural language input — Just tell the assistant what you want, and it builds the formula.
🌍 Supports multiple languages — Write in your preferred language, and Formula AI handles the rest.
🔍 Clear explanations — Understand how each formula works, with built-in step-by-step guidance.
🔄 Chat vs. Build Modes — Switch easily between our Help Center chatbot and the Formula AI Assistant depending on what you need.
⚠️ No mystery errors — If the assistant can’t generate a formula, it’ll tell you why — clearly.
You will find the Formula AI Assistant available now inside the Formula Editor — just click the yellow astronaut to get started.
Give it a try and see how much easier building KPIs can be!
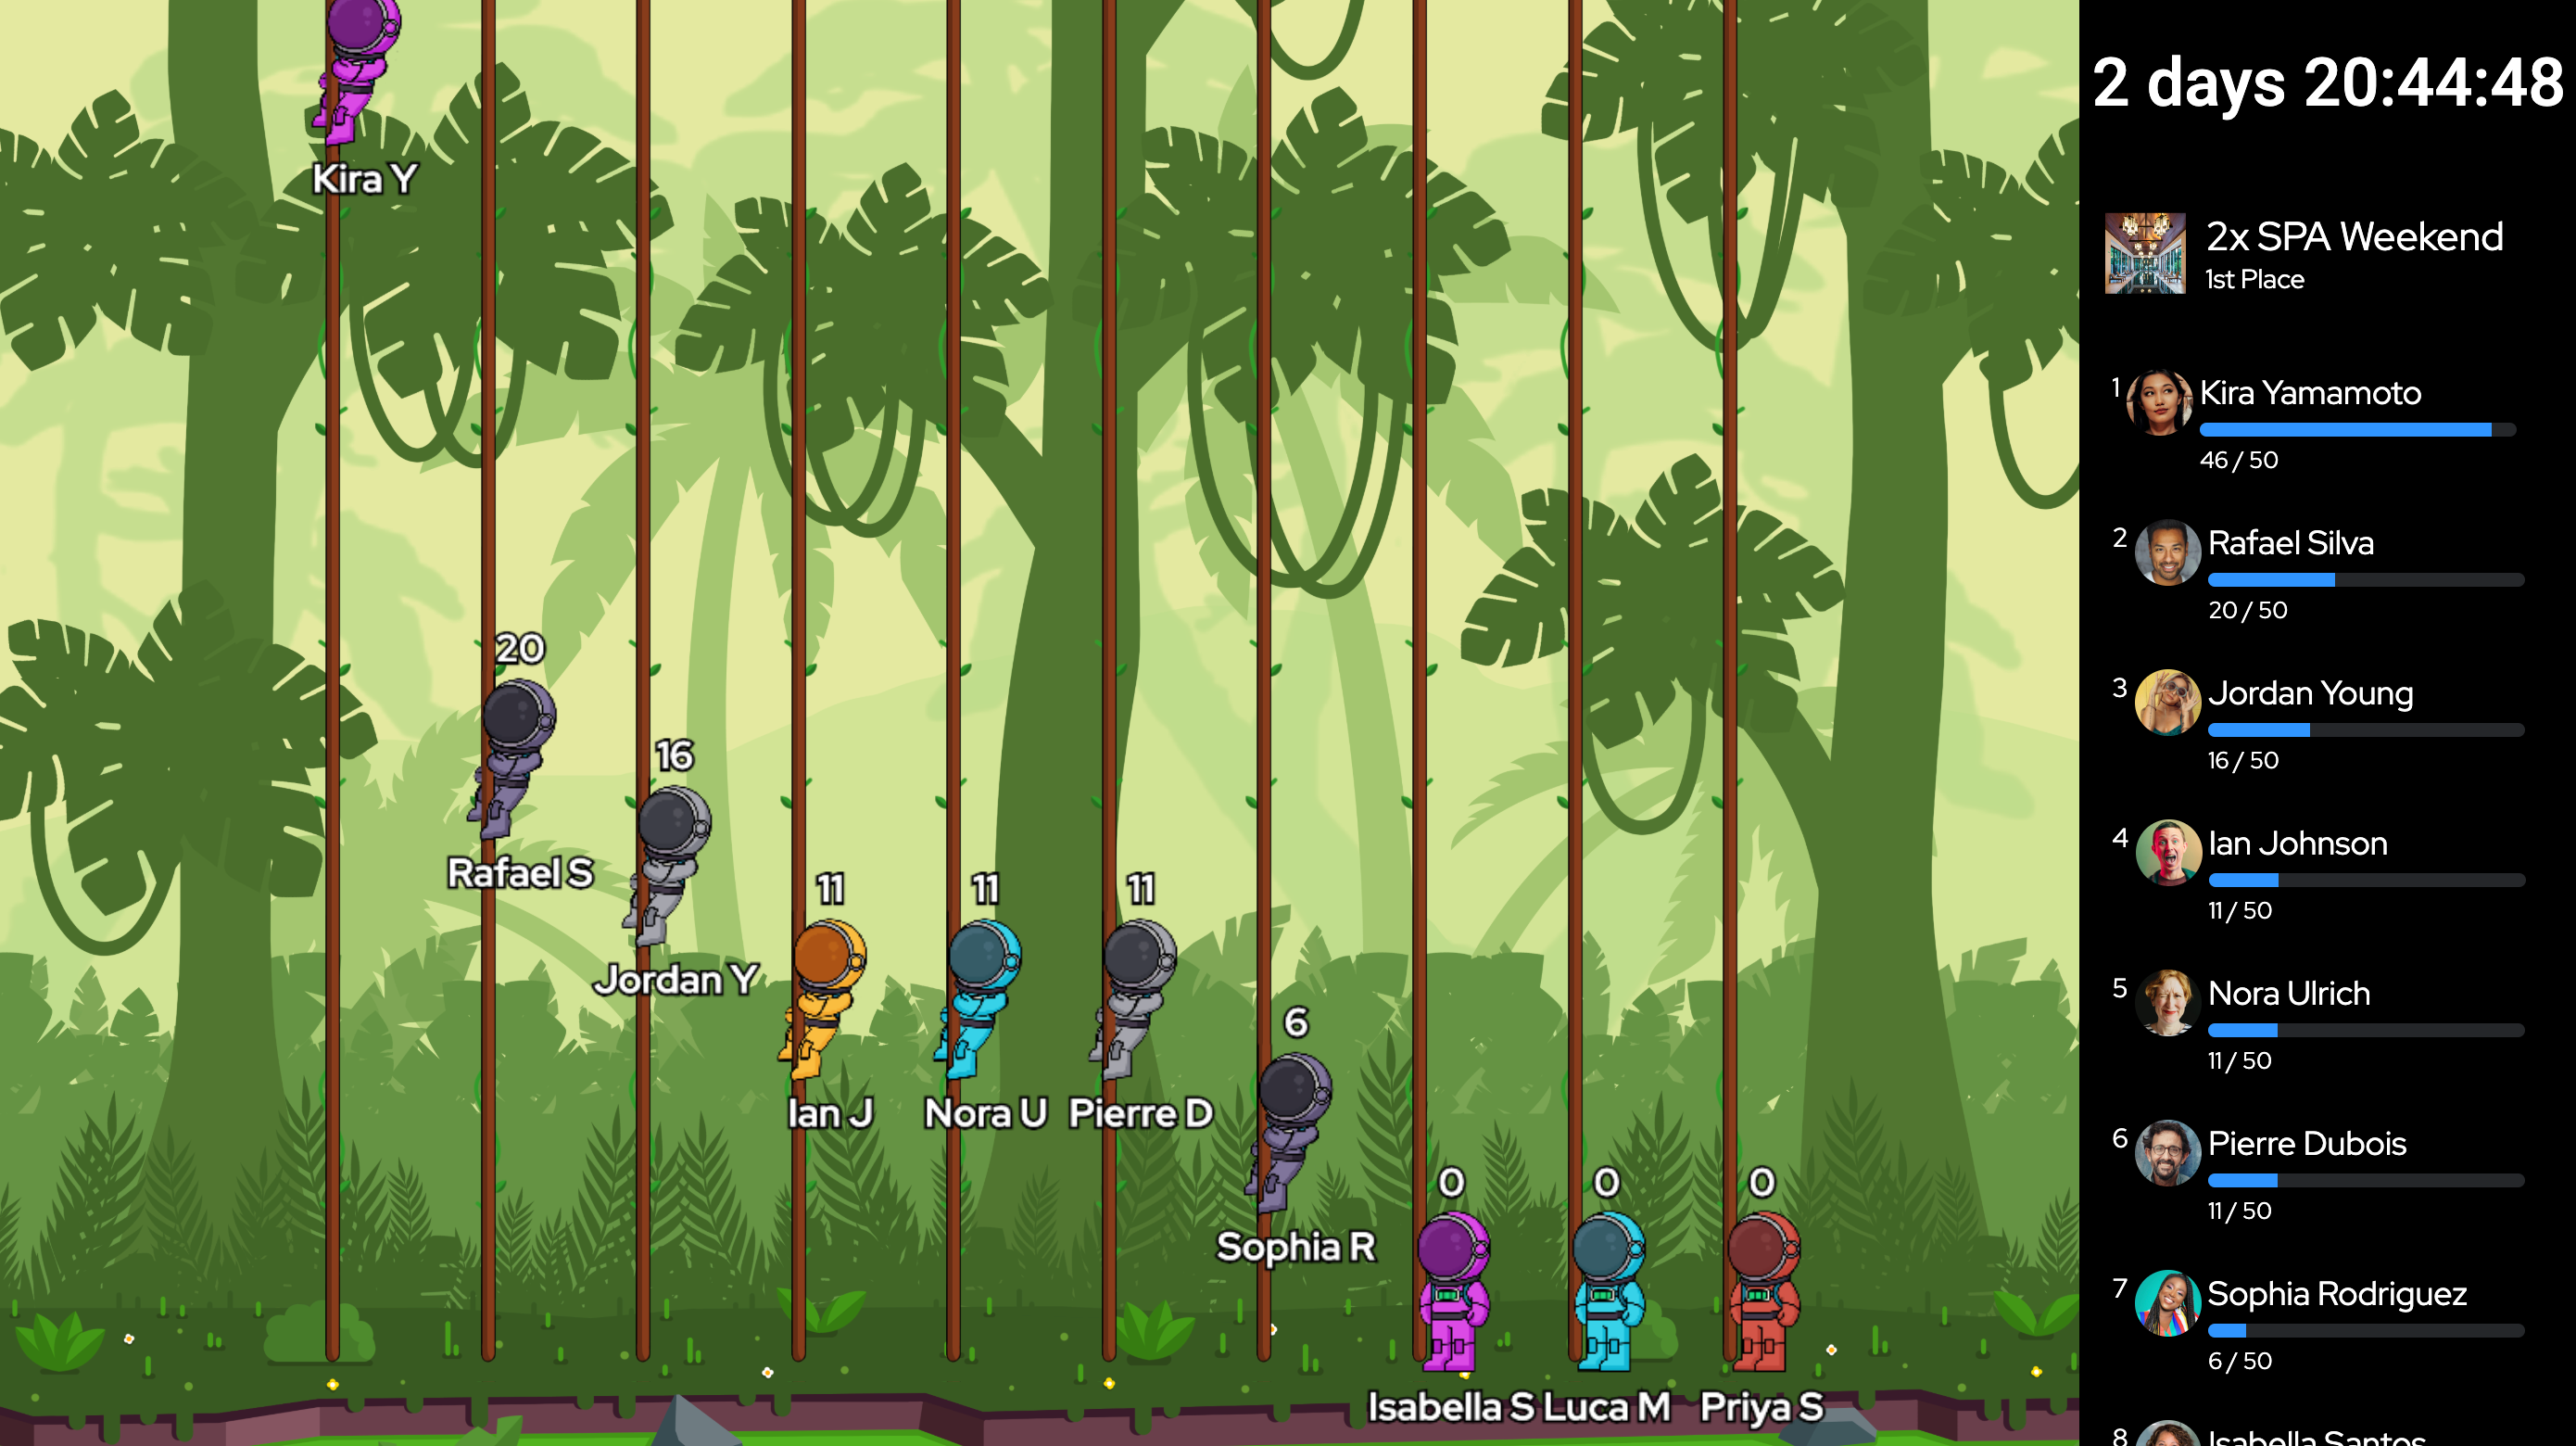
In Jungle, Astronauts and Humans trade spacesuits for climbing gear as they race to the top of towering lianas. Watch your team swing past their goals, overtake the competition, and conquer the canopy in this playful new layout!
It's the same powerful Contest mechanics, now with an extra splash of adventure.
👉 Head over to your Contests and try out the Jungle climb theme today!
Happy climbing! 🧗♂️🌴
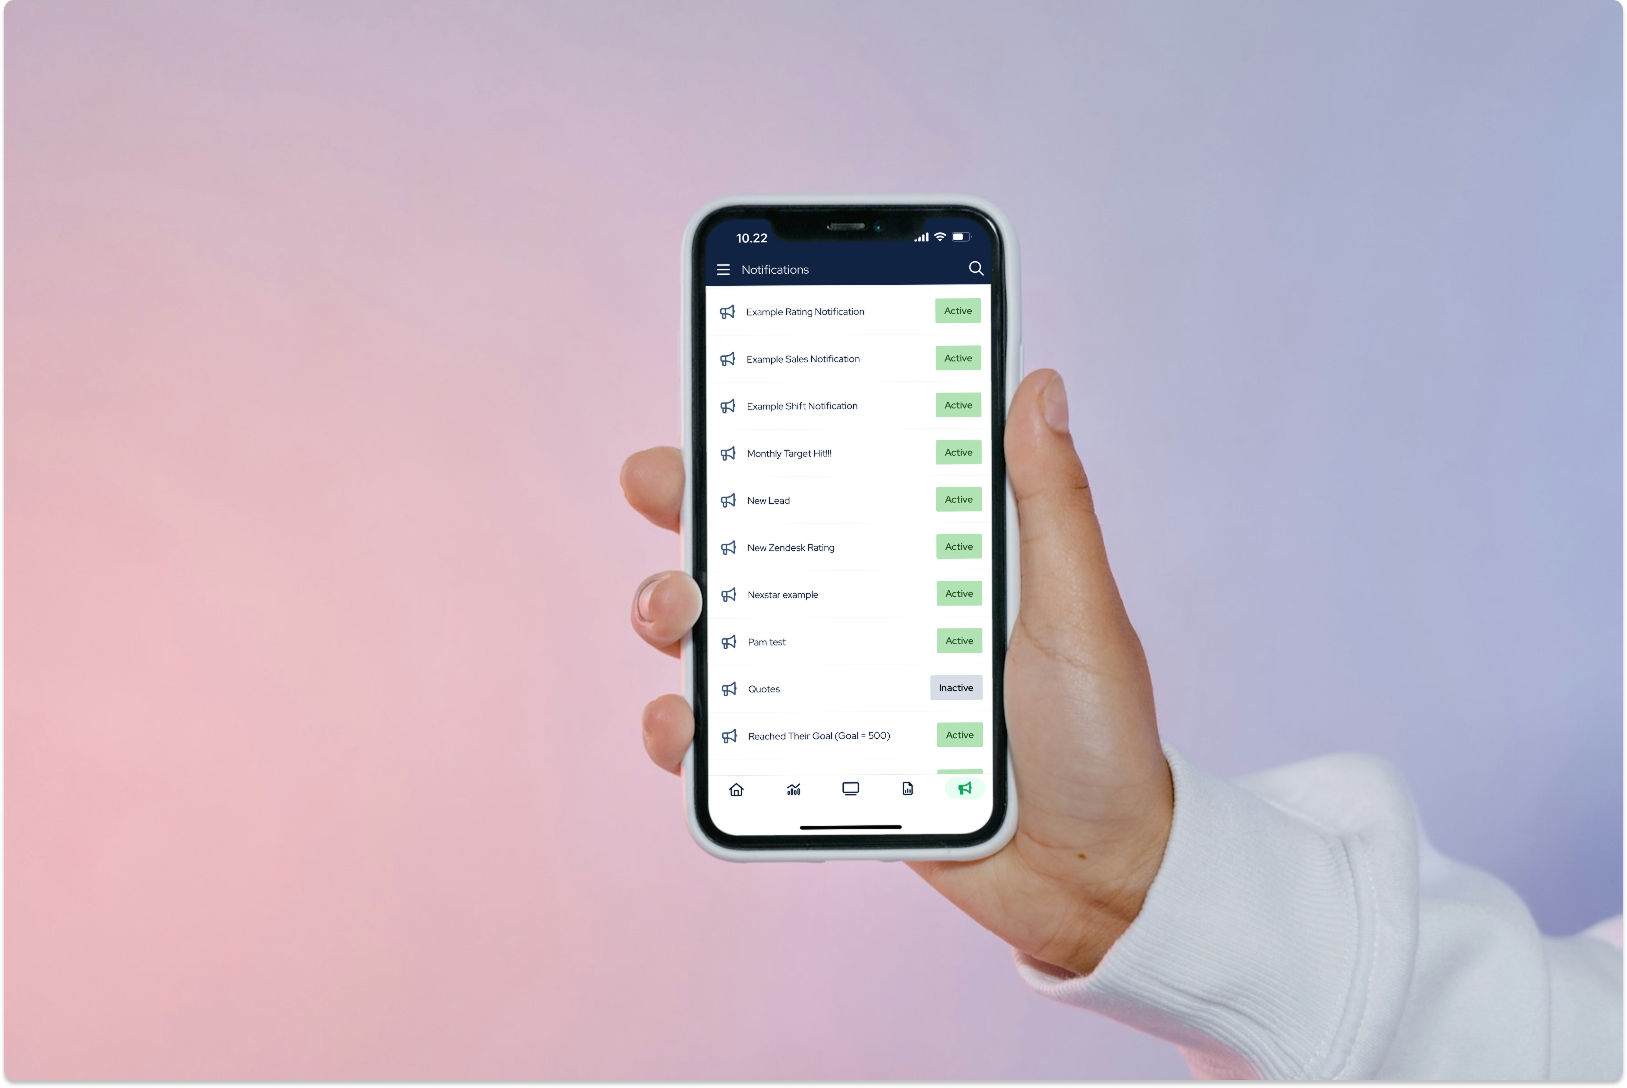
We have reimagined the app with a sleeker UI, improved navigation, and enhanced user experience to make your interactions with Plecto on mobile more intuitive and enjoyable.
Dive into the fresh new color palette, discover a more organized layout, and enjoy smoother navigation for everything you need—right at your fingertips.

This update is packed with improvements to help you stay focused, productive, and in control, no matter where you are, and more updates are on the way. 🙌 Update your app now and outperform, today!
Don't have the app? Download Plecto for iOS or Plecto for Android.
Based on your feedback, we have added exciting new features to elevate your gamification efforts and create better competitions for your team!
Hourly Contests ⏳
From now on, you can add hours to the contest! Add custom start and end dates down to the minute and schedule shorter contests, such as a call competition for an hour, an afternoon email race, and more! ⚡️

Avatars 🧑🚀
Personalize your contests with unique avatars! Whether you want to be a Human or an Astronaut, Plecto has a full dressing room ready just for you!
Go to your profile in the bottom-left corner and create your own contest avatar.

New Themes 🏔️
In addition to the classic contest themes, we've added two new themes: Mountain Race and Race in Space! Be it here on Earth or another planet, this theme will help you fight gravity and reach your targets! 🚀

Keep an eye out – more themes are coming soon!
Multiple Winners – Multiple Prizes 🏆
Celebrate champions, runners-up, or everyone! From now on, you can add up to 10 winners with different prizes for each. Oh, and you can award COINS, too! The coins can later be used in your own Reward Store.

Customizable Targets 🎯
The new contests let you add both static and dynamic targets! Enter a static number, choose a formula, or omit the target altogether, in which case the highest result will become the winner once the time runs out.
Target vs. End date: If there's no target, you must add a contest end date. If there's no end date, you need to have a target. If both the target and end date are added, your team can beat the target until the contest end! 💪
New Design, Easier Setup 🔌
Our redesigned interface makes setting up contests quick and hassle-free! With clear steps and layout, you can now save time and focus on what matters most – motivating your team and driving performance.
We have also updated the navigation menu so you can get to all the cool Plecto features in just one click, including contests!


Astro is trained using our Help Center and can answer a variety of questions about how Plecto works, such as:
If Astro can't find the answer to your question, you can still reach out to our support team via the question mark in the bottom-right corner or send an email to support@plecto.com.
We're confident that Astro will make finding help faster and easier for you! 💪

Here's how to customize your bottom menu:
To access the remaining features, settings, and more, click on your picture in the top-left corner. 🙌

Tailor your mobile app and streamline your workflow with this new customization option. Update your app today and enjoy a more intuitive and efficient way to access your favorite features!
Psst... 🤭 We are working on improving the mobile app, and soon you can look forward to even better mobile experience with Plecto!


How It Works
Write a prompt – describe what you need in natural language. For example:
"I want to see the value of won deals from Pipedrive."
Click Create – the AI will generate a formula based on your prompt. It's always a good idea to review and adjust the details.


Why Use the AI Formula Assistant?
Start simplifying your work with formulas in Plecto today with our AI Formula Assistant! Try it out and let us know your feedback as we continue to improve this powerful tool.

Euro 2024 has kicked off and, as is now tradition at Plecto for big tournaments, we've added new dashboard themes so you can show your support! 🇩🇰🇩🇪🏴🇫🇷🇮🇹🇳🇱
We've added 24 themes - one for each country taking part!

How does it work?
The contest widget is only available on the Home Screen – you won't be able to see contests inside the mobile app just yet. Adding contest widgets works in the same way as adding regular dashboard widgets to the Home Screen. Look for the [contest] label when setting up your widget. Learn more.


What are Calculated Fields?
– These are your custom columns in your Plecto data sources. With Calculated Fields, you can see how long it took from start to end date, create IF statements in the data source, multiply field values, convert text and number formats, and so much more.


Here's what's in store:
🟪 Group and Stack Data: Transform your conventional column chart into a two-dimensional powerhouse. Now, you can effortlessly group your chart by one metric and stack columns by another, opening endless possibilities for analysis and comparison.
🟪 Vibrant Color Palette: We've infused our column and donut charts with 12 vibrant, eye-catching colors. With this fresh palette, your data will pop like never before, making trends and patterns instantly recognizable.
🟪 Vertical or Horizontal? Your Choice! Customize your chart layout with ease. Whether you prefer vertical or horizontal columns, our upgraded column chart lets you switch between directions seamlessly.
🟪 Streamlined Widget Settings: We've revamped the widget settings layout for a smoother user experience. Now, configuring your dashboard widgets is more intuitive and efficient than ever before. Spend less time navigating settings and more time diving into your data.
🟪 Stacked Column Charts On-The-Go: Take your insights wherever you go! Our latest update extends stacked column chart functionality to mobile devices. Access your charts from your phone's Home Screen and stay informed, even when you're on the move.
___
1️⃣ Organize your Excel sheets: Add column titles in the first row and your data below. To track employee activity, add two columns where one contains employee emails and the other their names. Learn more

2️⃣ Upload to OneDrive: Add your spreadsheets to the cloud and let the magic begin. Whether it's sales data, financial reports, or a sign-up sheet for your next office party, connect it to Plecto with just a few clicks.

3️⃣ Integrate: Seamlessly integrate multiple sheets at once. Less manual work, more automated insights! Head over to the integration catalog and try it out.
This one's a game changer – customize your Home Screen like never before and add a whole new dimension with Plecto's new table widget for your Home Screen! Columns, conditional colors, pagination, and more. It's your data, your way!

Make sure your widgets are always up-to-date! From now on, you can use the all-new Refresh button and manually prompt updates to stay in the know!

Explore your data with ease as we bring you better legends for line, area, and column charts. No more guesswork – just crystal-clear insights!

✨ Update your Plecto app and experience better data visualization at your fingertips!
Here's what's new
⭐️ Active, Deactivated, and Pending tabs
From now on, all employee profiles are organized in three statuses – Active, Deactivated, and Pending:
⭐️ More control over automatic employee activation
Before, whenever you imported data that contained new employees, Plecto would automatically activate them and start tracking the employee activity.
Now, you have the option to stop automatic employee activation. New employees added to your organization will be moved to the Pending tab, where you will have to activate them manually. This new option gives you more control over your data and who you track in Plecto.
In addition, all Global Admins can receive email updates about new employees added to your organization.
⭐️ Smart merging of duplicate profiles
Clean up your organization in seconds! This new feature lists potential employee duplicates and allows you to merge employees based on automatic suggestions. Duplicate profiles are matched by the name, email address, and integration.
⭐️ Bulk actions
Create a team, merge, and deactivate – from now on, you can do all that in bulk! Select the relevant people and choose one of the actions from the bar at the bottom of the screen. These new bulk actions enable you to manage your organization more easily and save valuable time!
⭐️ Other great things
Among all the updates, we have introduced significant usability improvements:
🚨Changes regarding data imports for deactivated employees
As of February 14th, 2024, we are no longer importing new or changed data for employees after their deactivation date. If you do a historical import, we will only import the data created or updated before the employee’s deactivation date.
These new features are designed with you in mind – giving you more control, saving time, and ensuring your organization runs smoothly. Therefore, feel free to submit your feedback and help us make the product even better!
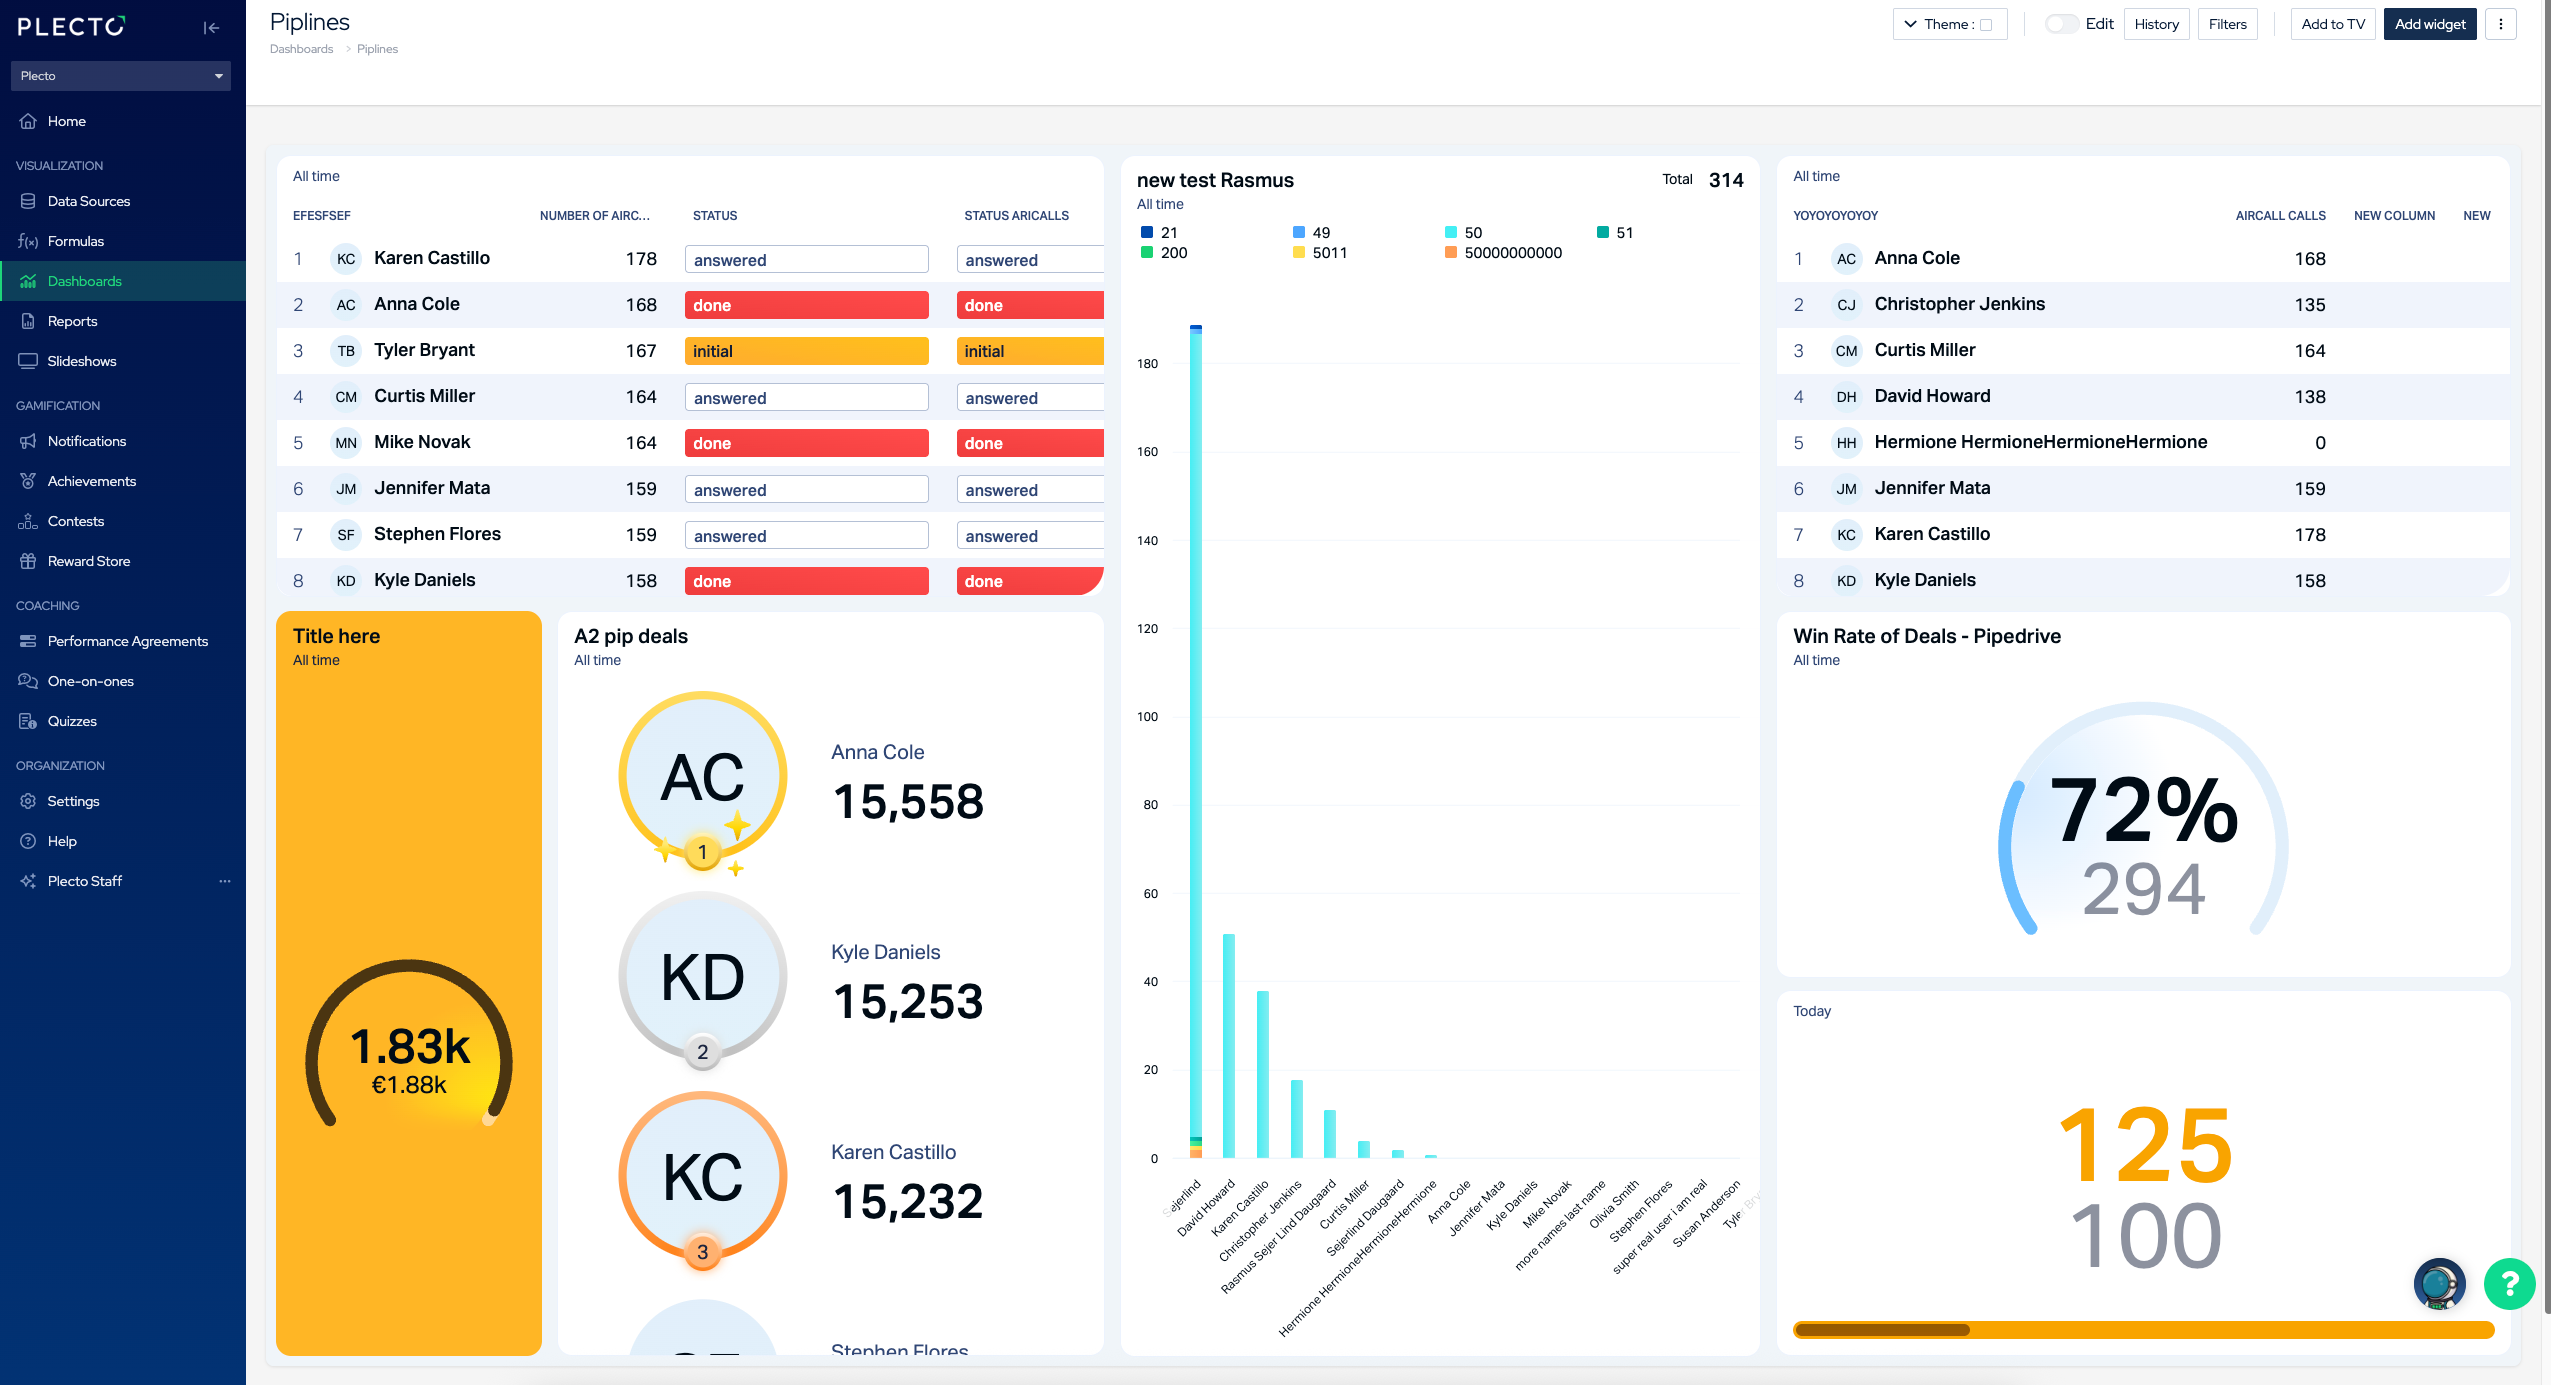
Filter your dashboards just like you would formulas. Choose data source fields and filter your KPIs by a specific customer, country, pipeline, or any other fields from the data sources included in your dashboard. This filter type will apply to the entire dashboard, and all relevant widgets will be updated, even if the used formulas have filters.
Admins can add a menu of possible filters for viewers to use. This filter type allows non-admins to explore data without changing the widget settings. All users with access to this dashboard will see a Filters button in the top menu, and they will be able to view the dashboard by your selected filters.
Along with this release, we have also updated the dashboard header, which now offers more functionality and some delicious-looking buttons. 😋

We've cut the cords! Forget about extra purchases – Plecto now synchronizes effortlessly with your Philips Hue lights directly from our platform.
Just add your credentials, choose your style, and watch the room light up! The new configuration ensures you spend less time setting up and more time focusing on triggering that notification.


What's new
🌟 Better overview of your data. The new integration process now lets you preview and choose among all the available data source fields even before you import your data. Just like the list you see in the data source settings, this new update ensures you get the right data, right from the start.

🌟 Upfront import range and data retention. Choose from the get-go how much data you want to import, and how long Plecto should keep the registrations in your data sources.

🌟 Automatic organization. We will now automatically create folders for your integrations, helping you keep your data sources neatly organized.

🌟 Enhanced integration catalog. You might notice that we updated the categories in the integration catalog to help you navigate with ease and find your systems faster.

🌟 Improved guidance. Our improved help texts and generally upgraded connectivity give you clear and concise guidance so you can easily integrate from A to Z and always know what the next steps are.
Go to the data source page and try out the new streamlined integration process today! 💪
With this new feature, adding numbers to your dashboards is now quicker than ever. Simply input your targets in seconds and focus on what truly matters! 💪

With templates, you can unlock the power of instant productivity. Build your dashboards smarter, faster, and elevate your performance tracking to new heights. What's more, everything is 100% customizable!
👇 Watch the video to learn how to use templates!
Streamline your workflow with our innovative templates – your shortcut to boosting performance in real time! 🚀

What's new?
This new feature comes directly from your ideas and input shared in our Product Portal, and this is how it works:

💡 Find what objects are shared with you by clicking on your profile in the bottom-left corner of Plecto!
How do I participate?
To learn more about this feature, read our help article on docs.plecto.com.
What's new

We are extremely happy to announce that we've released five new functions in Calculated Fields! 🚀 🙌
We also improved the interface with good-looking buttons and a toolbox, so you always have your functions at hand! Learn how to use each of the Calculated Fields functions in our help article.

You can now filter data by multiple values. For example, to see how many leads you got from specific sources, you can add a filter where the source IS ONE OF the following: AAA, BBB, or CCC.
The filter works with number, text, and choice fields and is available in both the Visual and Advanced Formula editors.


If you're an admin, go to Formulas and see how you can upgrade your organization's KPI-tracking using "is one of"! 💪
To group your data by Custom field:
You can find custom grouping in: Table, Line, Area, Column, and Donut chart.

To learn more about how you can group data on dashboard widgets, read our help article. 🙌
Formulas are at the core of Plecto – a single formula lets you visualize multiple KPIs, organize a contest, discuss performance during a one-on-one meeting, and so much more. Whether you're a seasoned formula expert or a new user, we want to make it easy to work with Plecto! And that's why we are excited to announce...
From now on, if you want to create a simple, one-component formula, you can do it directly on the widget without ever opening the formula editor!
Add an extra layer to your formula using overrides. If you modify the formula on a widget, it will only apply to the widget in question and not affect the original formula.
To keep the house in order, we grouped the widget settings into three sections – Formulas, Filters, and Display settings.
With formulas in widgets, you now have the ultimate toolkit to effortlessly create dynamic KPIs that display your business metrics in real time! Go to your dashboards, try it yourself, and let us know what you think! 💡

This new feature makes it so much easier to build straightforward, one-component formulas. To learn more about how to use it, check out our help article. 🚀
We have already prepared everything – all you need to do is open https://www.plecto.com/WC-2023 and follow the matches!


Configure your organization's News Feed under Organization > Settings. To receive posts about triggered notifications, update the notification actions. Learn more.
Here's how to use it

The spinning wheel is a shiny new addition to our Gamification+ package. To give it a try, head over to Organization > Billing where you can get a 14-day free trial for not just the Spinning Wheel but everything else in Gamification+
🔄 You can reset the order by clicking the more options button in the FILTERS header.
Our data sources got an upgrade – from now on, you can add new fields to all integrations right inside Plecto. Here's what you can achieve with the new Calculated Fields feature:
What's great – it is up to you to define what gets shown in a calculated field! Use it to calculate how long it takes to close a sales deal, prepare an order, complete a task, calculate gross/net values, and more.

As of now, if your TV runs on Android, you can find Plecto in your TV's app store! Once installed, you will be able to activate a slideshow using your computer or mobile app:
We are developing apps for TVs to make Plecto more reliable and ensure that all the features are supported. Since this is a BETA release, we encourage you to help us test the app so that we can make it as good as ever.
💡 If you have any feedback or ideas for new features, please don't hesitate to submit them in our Product Portal!
With this update, we're embedding our help center inside Plecto as well as launching our new help domain docs.plecto.com!
We've also added a new menu point – 🚀 Getting started. There, you can look forward to lots of exciting content. We'll add new articles and checklists as soon as we launch new features so that you're the first one to get informed.

If you want to chat with an agent, there's a Contact us button at the bottom of each page inside the knowledge base. It will open the live chat.
We're launching 4 new modules that you can add to your current subscription as paid add-ons in addition to the standard Plecto packages. 🎉
Stop copy-pasting hundreds of dashboards or come up with different workarounds for how to visualize individual KPIs. A dynamic dashboard understands who's looking at it, so it only shows the viewer's data to the viewer. Now, you can create a single dashboard, and we'll take care of the rest!
Psst... one click in the dashboard settings, and you can transform an existing dashboard into a dynamic one!

One-on-ones
Watch the video
Use this coaching feature to build stronger relationships between managers and team members. Align your goals and direction, and keep track of your team's well-being.

Quizzes
Watch the video
Organize internal learning, pinpoint knowledge gaps, and foster development with quizzes! Add different types of questions, learning resources, and information slides and invite participants to take the quiz by scheduling virtual quiz sessions. The quiz results are stored in a data source, which allows you to visualize the learning progress.

Build your own reward store and incentivize your teams to reach their goals. Automate virtual coins with notifications and let people grow their coin balance as soon as they reach a milestone and trigger a notification. The Reward Store is easy to set up and maintain.

Add SSO to your organization and log in more conveniently! Plecto's SSO can be used with a variety of different identity providers, including OneLogin and Google.

The cat’s out of the bag now – it was all part of a bigger plan! We’re excited to finally show you a completely remade achievement form!
What's new?


More good news
What else – no more random week numbers! If your achievement cycle is a week, you no longer have to memorize all weeks of the year. How? – We added dates to each week! 🤩
All active and past achievements are stored in each employee’s profile. See your achievement timeline by hovering over the badge.
We also modernized the way you give achievements manually. Open an employee page and see what's new!
We hope you enjoy this feature just as much as we do! 🌟 If you have any feedback, please don’t hesitate to contact us.
Want to join our BETA testing group? If you are a customer, sign up here!
Do you remember that feeling of having to delete formulas one by one? – Well, not anymore! With this update, we're introducing folders, bulk actions, and drag and drop. And we're only getting started...
We're taking our first steps in introducing folders and bulk actions across the platform. Here's what's new in this release:
🔸 Create folders
Easily create, organize, and rename your folders. We've added the Create folder button in multiple places, so you won't miss it.

🔸 Select multiple items
Select multiple items and create folders based on the selection. We've also introduced some keyboard shortcuts – hold down the Shift key to select multiple formulas or press Esc to clear the selection.

🔸 Organize your folders and formulas using drag and drop
Move your folders and formulas around more easily. Grab one or multiple items and drag them to a different destination.

🔸 Cleanup made easy
You can finally delete multiple items at once, but only those that are not in use. If a formula is in use, you'll have to find a replacement for it. This is to ensure that you don't lose any metrics (on dashboards and reports) or don't break any existing setup (contests, notifications, performance agreements).
We're continuously working on improving our features, so stay tuned for more updates! Meanwhile, give us some feedback and let us know what you think.

The lock screen widget menu is the same as for the home screen. Here are the widgets you can add:
⚠️ Can't see Plecto on the list?
Apple seems to have some trouble displaying apps in the menu. Make sure you have the latest version of Plecto. If you still can't see the app, try deleting and reinstalling Plecto on your phone. We know it's not ideal, but it will fix the issue.

Download the mobile app
Connect your Plecto slideshows to TVs faster and keep track of your performance with our mobile app! The app is free and available for both iOS and Android devices.
You gave feedback – we listened. With the new dashboard design being far more superior to the old one, there were still a couple of things we needed to improve. Most importantly, you asked for resizable columns – you got it! 💪
👉 With this update, we added the option to change the column widths on table and timeline widgets.

Enable the Edit mode on your dashboard and click Edit on your table or timeline widgets. You will see vertical bars in the column header. Drag the bars to the right or left sides to adjust the column width. ↔️

We also added a Reset column width button in the column settings. Edit the widget and click on the three little dots in the column header to reset.

Got feedback? We would love to hear it!
Click the chat icon in the bottom-right corner and tell us what you think.
We're excited to announce that over the next few months, we’ll be hosting 5 webinars where we’ll be diving into all things Plecto.
Whether you’re still finding your feet with the platform or an experienced user, we'll show you invaluable tips and tricks to ensure you can get the most out of Plecto.💪
1. Say Hello to Plecto's New Dashboard Design 👋 – August 25
In case you haven’t noticed yet, we have had a bit of a redesign! Learn about our fresh new dashboard design and explore our new widgets. Register now

2. Beginner's Guide to Building Performance Dashboards – September 22
Need a refresher course? In this webinar, we'll go back to basics and give you a step-by-step guide to building dashboards and boosting your performance. Register now

3. How to Create a Performance-Driven Culture With Gamification – October 27
Want to discover more about how you can use gamification to your company’s benefit? Learn how to use Plecto’s gamification features, including how to set up contests, notifications and more! Register now

4. Remote Working & Performance on the Go – November 17
For many businesses, working from home has become the new normal. This webinar will show you how to visualize your business metrics for remote teams or employees who are often on the go! Register now

5. Plecto Advanced Masterclass – December 15
Advance your Plecto setup! Gain expert insight on how to create more complex KPIs and get to the heart of your business. Register now

At the end of each webinar, you'll get the chance to ask topic-related questions during a Q&A session. Don't miss out – register now!
We're announcing the biggest dashboard update Plecto has ever seen!
Starting today, you get a completely new dashboard design that significantly improves your experience of tracking KPIs on TV screens. 🙌 We have aligned the widget elements and increased passive readability – you can now get a better overview of your data without interacting with the dashboard.


Widget animations. The donut and column charts will automatically highlight their elements every once in a while (approx. every 6 minutes).
More layout options. The donut chart and leaderboard have both horizontal and vertical layouts.

Leaderboard ranking. From now on, employees and teams with the same results will have the same ranking. For example, if Susan and Jennifer both made 17 calls, they would share the first place on the leaderboard.
Summary. Add a KPI summary in the top-right corner of a widget and see the total, average, or latest values. The summary is available on the line, area, column, and donut charts, as well as leaderboards.


... and more! Go to your dashboards and try the new design to see the changes. 🙌

💡 Be aware that once you switch to the new design, you might have to resize some of the widgets – they might need more or less space than before.
Since you might have to update some of the dashboards, we've decided to open a 30-day transitioning period after which we will implement the new design permanently and remove the old one.
Learn more about the dashboard widgets in Plecto Help
We are introducing granularity for area and line charts on dashboards!
From now on, you are the one who decides the size of your data points. Are you looking at KPIs from the current month? With granularity, you can split your data points into days, weeks, and more.
The granularity options depend on your chosen time period.

Read more about the widgets in our help article Area & Line Charts.
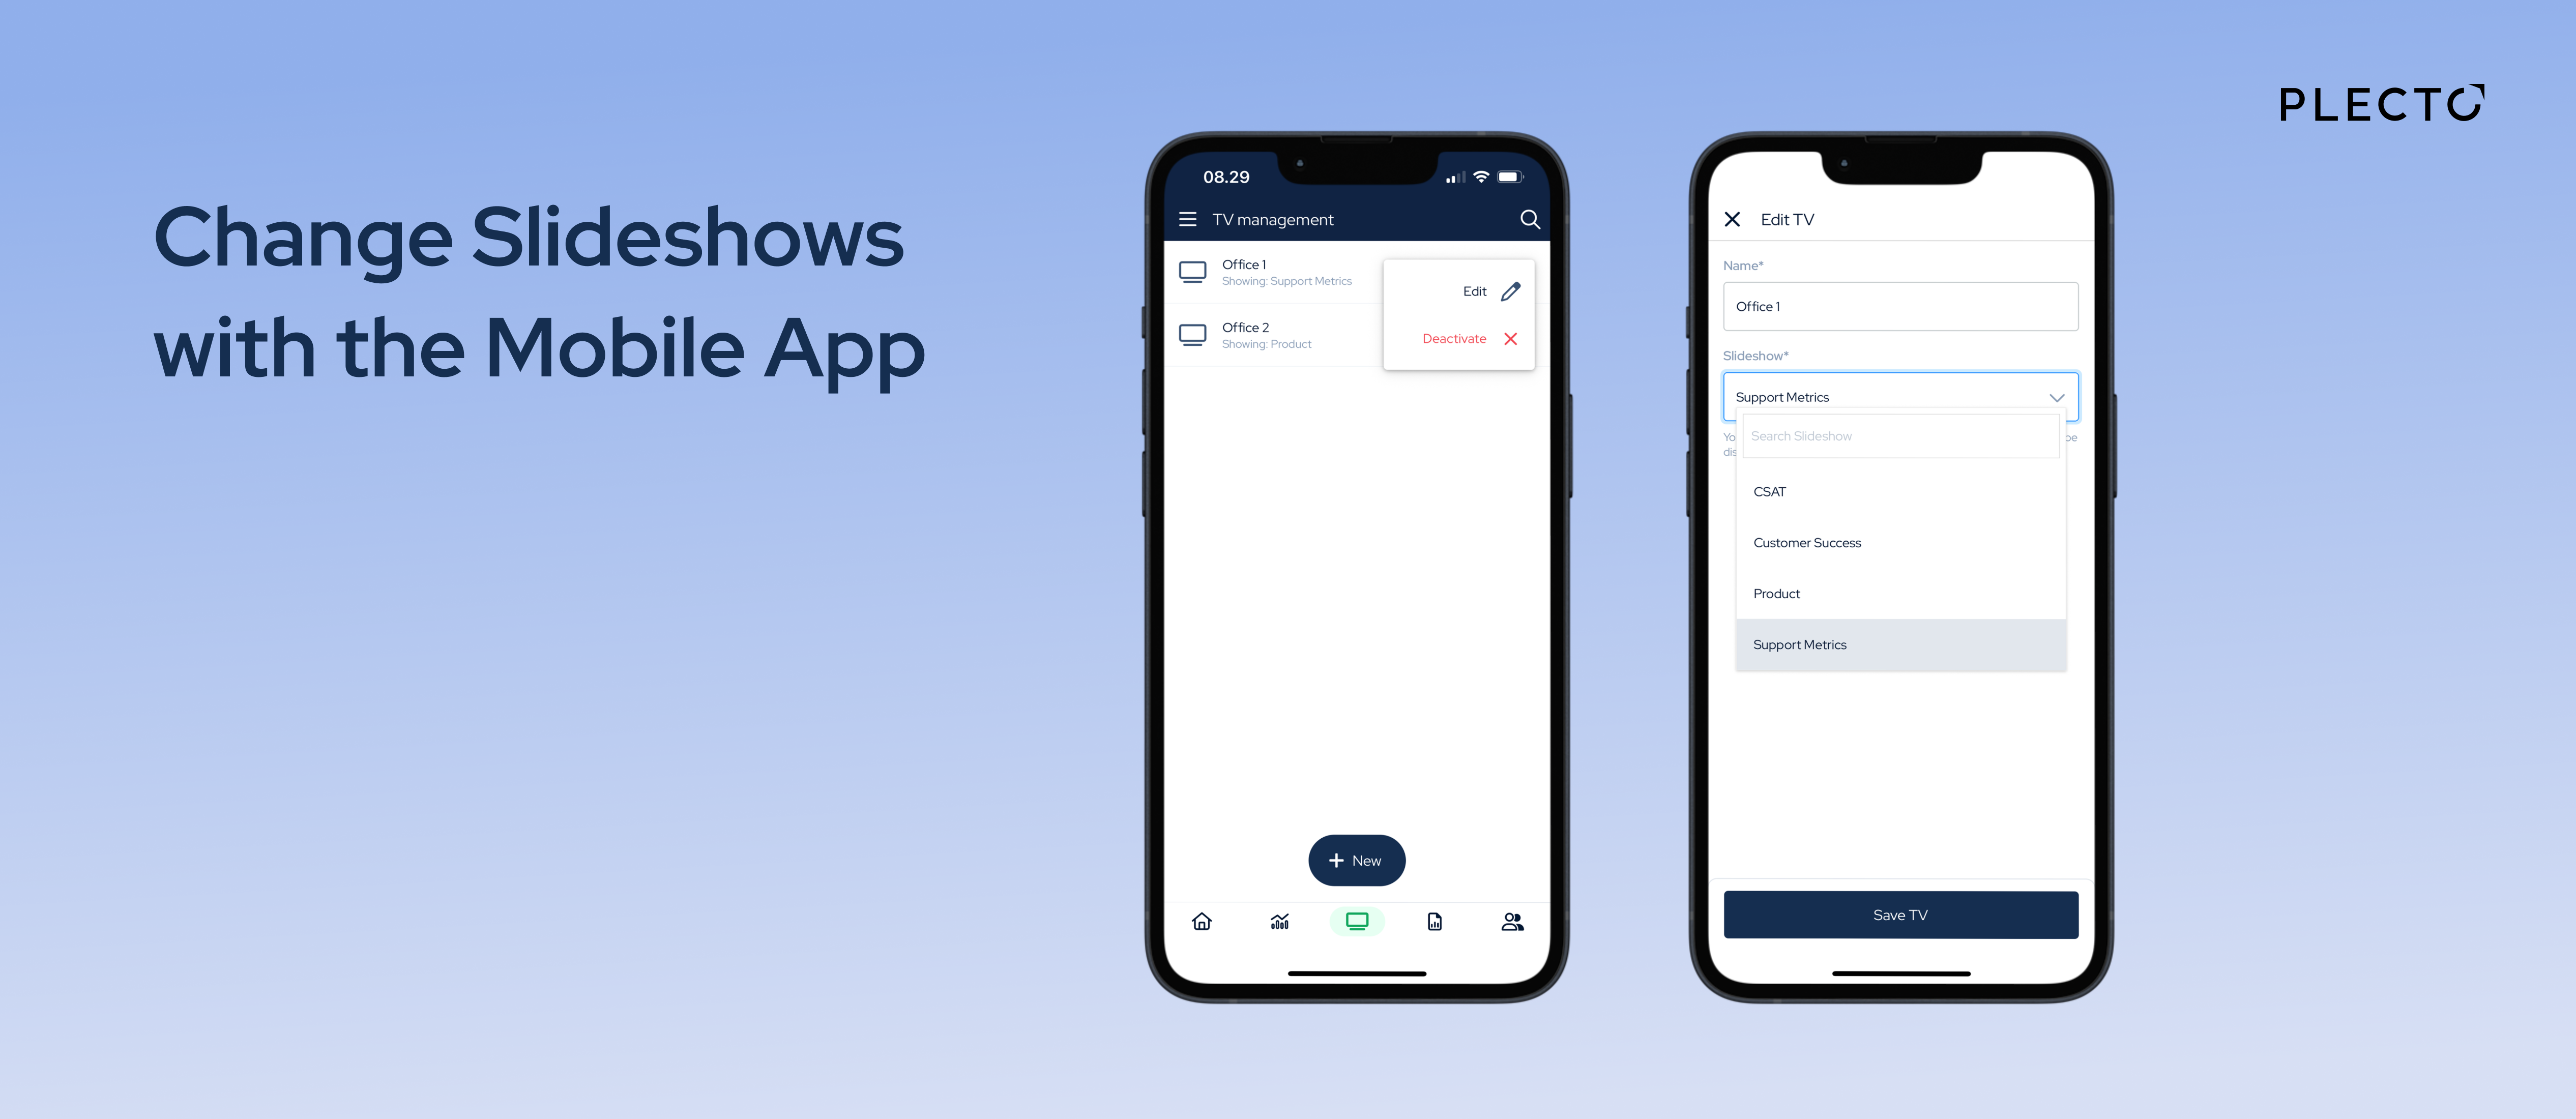
We have released an update that makes it significantly easier to activate and manage your slideshows and TVs! 🙌 Previously, you had to go to your profile, where you would only see the TVs you yourself had activated. To help your organization keep better track, we moved all the activated TVs to their own section called TV management.

In there, you will find a list of the activated TVs, including the names of the slideshows, who activated them, and more. You can also edit the TV name or deactivate it – all in one place. Cool, right? 💪
Having a central place for all your organization's TVs makes it much easier to get an overview and control and manage your screens.
This new feature is available to all Global Admins and employees with permission to edit the Slideshow feature.